
Connected Cycling & Micromobility Data for Vision Zero
Advanced cycling data insights that help cities achieve their vision zero goals
What is Vision Zero?
Vision Zero is a global road safety initiative that aims to eliminate all traffic-related fatalities and severe injuries.
It places an emphasis on safety in road design by identifying and addressing risk factors across to prevent fatal outcomes from collisions, prioritising the creation of a safe road system over simply fixing crash spots.
Are you applying for the SS4A Safe Streets and Roads for All Grant?
The Safe Streets and Roads for All (SS4A) grant program, aims to reduce traffic fatalities and injuries across the U.S. It provides funding to various entities for developing and implementing comprehensive safety action plans and projects. Emphasising a "Vision Zero" approach, the program seeks to eliminate all traffic-related fatalities and serious injuries, enhancing mobility for all users through infrastructure improvements, safety measures, and technology-based solutions.
Get in touch to find out how our unique data insights can support a successful SS4A grant application.
CONTACT USWhy Quality Data Matters For Vision Zero

MOVE FROM REACTIVE TO PROACTIVE
Traditional safety reporting is reactive, relying on historical police crash reports (such as the STATS-19 report in the UK), which offer lagging indicators rather than leading ones. By utilising See.Sense connected cycling data, you gain access to near-real-time insights.

GAIN VISIBILITY ON ‘NEAR MISS’ EVENTS
Not all crashes are reported to the police, and this is even more likely to be the case in regards to ‘near miss’ events’ and single bicycle crashes (Shinar et al, 2018). See.Sense data on extreme swerving and braking event acts as a surrogate safety measure for near miss events and has been proven to help identify hazardous locations for cyclists (RoSPA, 2022).

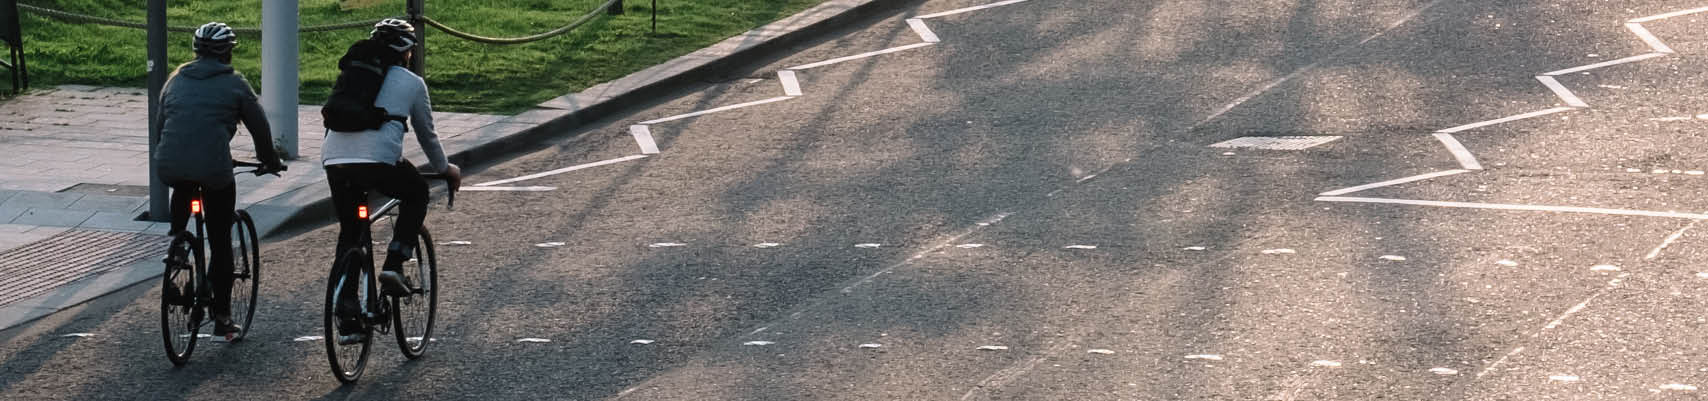
INFORM HOLISTIC RISK ACROSS YOUR NETWORK
The majority (58%) of cycling fatalities occur over 20m away from junctions. See.Sense offers a unique perspective beyond junctions, where cameras are typically placed, allowing for a better grasp of cyclists' real experiences on your network. This approach also considers solo cycling accidents, which can make up to 29% of all collisions.


MEASURE THE IMPACT OF YOUR INTERVENTION
Use See.Sense data to baseline and monitor the impact of your intervention, providing evidence needed to demonstrate the effectiveness of your Vision Zero initiatives.

See.Sense Technology & Data
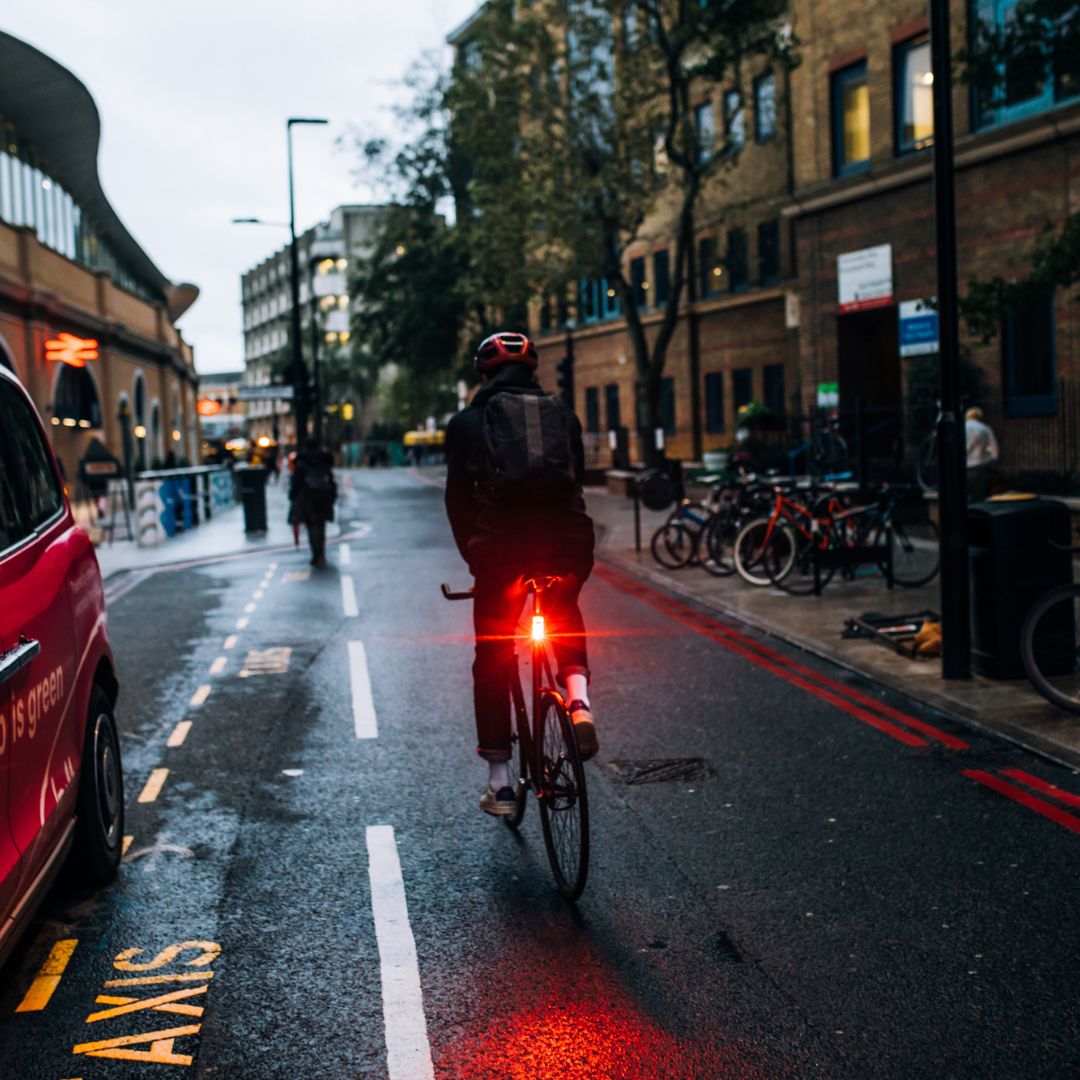
At See.Sense we harness the power of technology to predict where collisions involving cyclists are likely to occur.
Our technology captures a wealth of information, from road surface conditions to cyclist behaviour, providing a comprehensive view of how road networks are performing for cyclists. By leveraging this data, you can identify high-risk areas and prioritise safety interventions:

Swerving
Identify areas of high-swerving to anticipate and prevent collisions.

Braking
Use heavy braking patterns as a leading indicator to proactively prevent potential collisions.

Speed
Measure the speed of cyclists to identify patterns and optimize routes for more efficient cycling.
Dwell Times
Analyze cyclist dwell times in specific locations to optimize the layout of cycle infrastructure.

Road Roughness
Measure road quality to optimize routes and avoid damage to bikes.

Movement Patterns
Understand how cyclists move through your city and identify areas for improvement.

Collisions
Track accident hotspots and analyze collision data to improve safety for cyclists.

Survey Reports
Collect feedback from cyclists to gain insights into their experiences.


How See.Sense Data Can Help Your City

Identify High-Risk Areas:
Pinpoint collision hotspots and areas of concern on your road network with precision.


Prioritise Interventions:
Allocate resources effectively by focusing on the areas with the greatest need for improvement.

Measure Impact:
Track the effectiveness of interventions and make data-driven decisions to enhance road safety.
Empowering Vision Zero Across The World

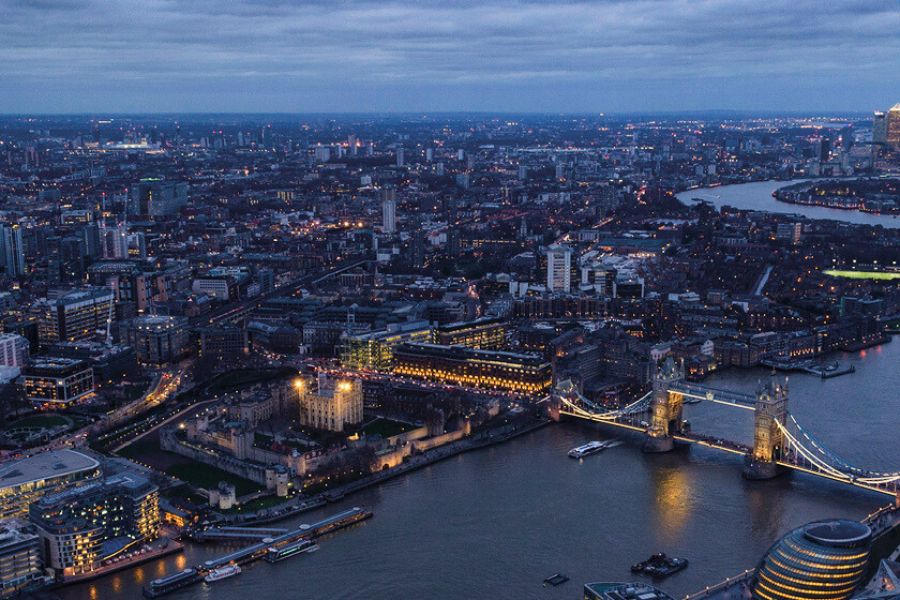
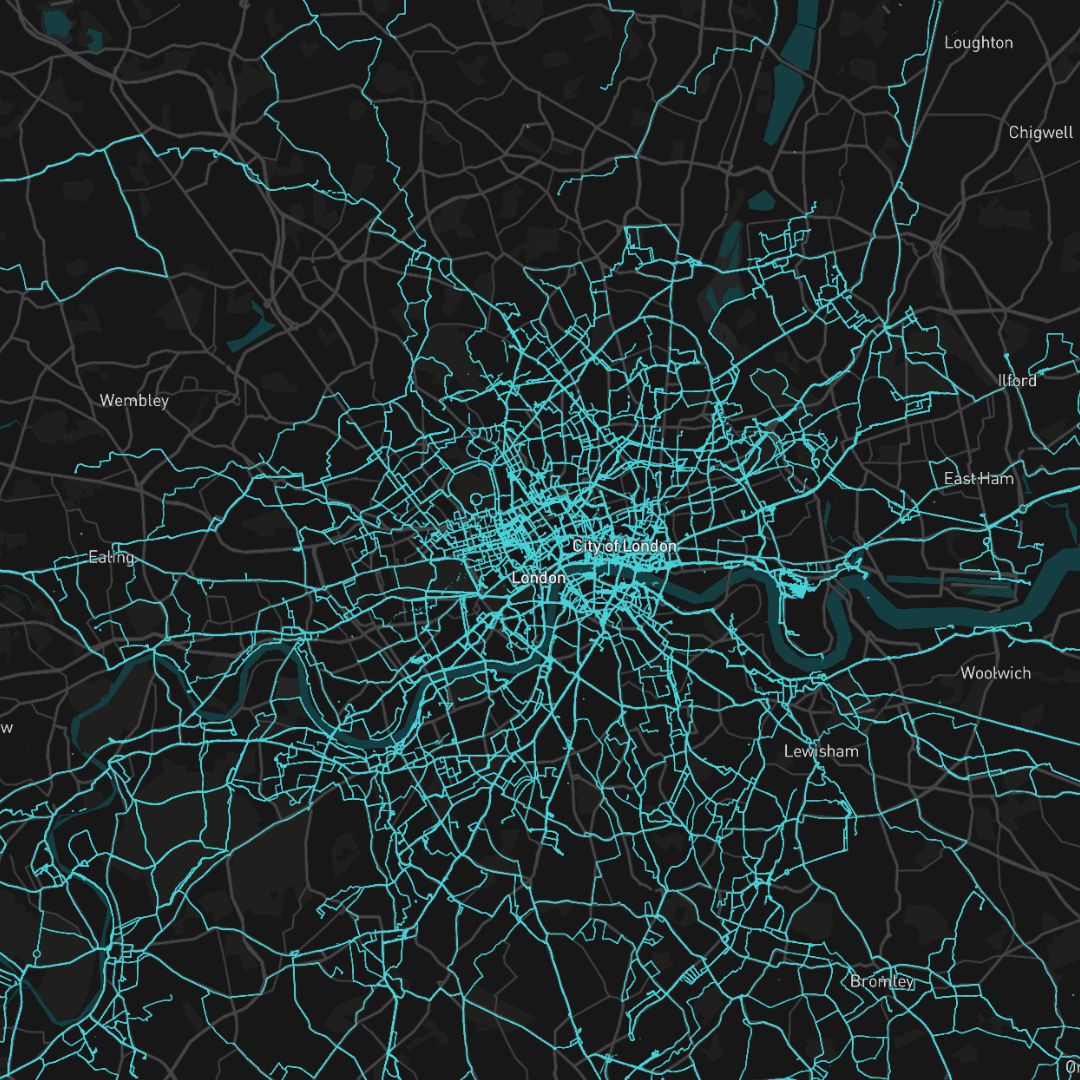
Transport For London
Read More
"See.Sense provided over 5.4 billion crowdsourced sensor readings from their sensor-enabled connected bike lights. Insights on road condition, speed, swerving and braking allowed us to identify where cyclists face riskier journeys in London, helping us to plan improvements to our network and achieve London's Vision Zero ambition."

Royal Society For Prevention of Accidents
Read More
"We would propose that this could form the basis for a useful investigative tool to quickly identify the most hazardous cycling areas."


Downtown Denver Partnership
Read More
"The data presented highlights significant findings in the everyday safety and experiences for cyclists in the City and County of Denver."
Recognition and Awards
Our dedication to advancing road safety and vision zero goals has been recognised by industry leaders and organisations: